How to Troubleshoot Kubernetes Node Not Ready Error
Have you ever faced a situation where a node in your Kubernetes cluster suddenly goes into a “Not Ready” state?
It’s a common yet frustrating issue that can disrupt workloads, delay deployments, and even affect your application’s availability.
The Node Not Ready error typically arises when a node fails health checks due to reasons like resource exhaustion, kubelet misconfigurations, or network issues. Resolving this error promptly is crucial to maintaining a healthy and responsive cluster.
In this blog, we’ll walk you through:
- What the Node Not Ready error means.
- How to diagnose and troubleshoot it effectively.
- Best practices to prevent it from happening in the future.
By the end of this guide, you’ll have a clear understanding of how to handle the Node Not Ready error and ensure your Kubernetes cluster remains stable. Let’s get started!
What is the ‘Node Not Ready’ Error
The “Node Not Ready” status in Kubernetes indicates that one or more nodes in your cluster are unable to perform their expected functions. This error prevents the affected node from scheduling or running workloads, which can cause service disruptions and delays in deployment.
Common Causes of the Error
- Resource Exhaustion:
- Nodes running out of CPU, memory, or disk space are a frequent cause of the “Not Ready” status.
- Kubelet Failures:
- Misconfigured kubelet settings or issues in the kubelet service can lead to nodes failing health checks.
- Network Connectivity Problems:
- A node losing connection to the control plane (master node) or other critical components can trigger the error.
- Disk Pressure or Storage Issues:
- Nodes with insufficient disk space or high disk usage often enter the “Not Ready” state to prevent further degradation.
Understanding these causes is the first step in diagnosing and resolving the Node Not Ready error. Next, we’ll look at how to systematically identify the root cause using Kubernetes tools and logs.
How to Diagnose the Node Not Ready Error
Before fixing a Node Not Ready error, it’s essential to identify its root cause. Kubernetes provides several tools and commands to help you pinpoint the issue. Follow these steps to diagnose the problem effectively:
Step 1: Use kubectl get nodes
Start by listing all the nodes in your cluster to identify which node is marked as “Not Ready.”
Example command :
kubectl get nodesThe output will display the status of all nodes, including their readiness. Look for nodes with a STATUS of “Not Ready.”
Step 2: Inspect Node Details with kubectl describe
Next, examine the events and conditions reported for the problematic node.
Example command:
kubectl describe node [node_name]Replace [node_name] with the name of the node you identified in the previous step. Pay close attention to:
- Conditions: These indicate the health status of node components (e.g., DiskPressure, MemoryPressure).
- Events: Any warnings or errors that might explain the node’s status.
Step 3: Check Node Logs
If the issue isn’t clear from kubectl describe, review the node’s logs for further insights. SSH into the node and check the kubelet logs:
Example command:
journalctl -u kubeletLook for error messages related to resource limits, communication failures, or service crashes.
Step 4: Validate Network Connectivity
Test the network connection between the problematic node and the control plane (master node). Common commands include:
Ping the master node:
Example command:
ping [master_node_IP]Test API server connectivity:
Example command:
curl -k https://[master_node_IP]:6443/healthzThese checks help determine if network disruptions or firewall rules are causing the issue.
Step 5: Check Resource Usage
Inspect the node’s resource consumption to identify potential bottlenecks.
Example command:
kubectl top node [node_name]This command provides metrics like CPU and memory usage, helping you identify resource exhaustion.
By following these steps, you can systematically diagnose the cause of the Node Not Ready error and move on to applying the appropriate fix.
What Are The Common Fixes for Node Not Ready Errors
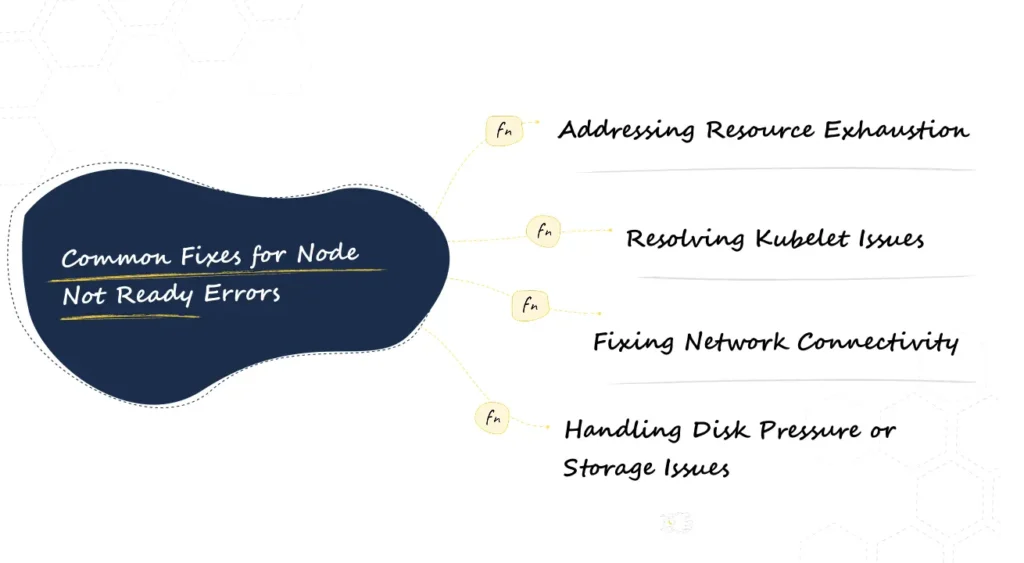
Once you’ve identified the root cause of the Node Not Ready error, the next step is to resolve it. Below are the most common fixes based on typical causes:
1. Addressing Resource Exhaustion
If the node is running out of CPU, memory, or disk space, follow these steps:
Check resource usage with:
Example command:
kubectl top node [node_name]Restart resource-heavy pods: Identify and restart pods consuming excessive resources.
Example command:
kubectl delete pod [pod_name]- Reallocate resources by adjusting pod resource requests and limits:
- Edit the deployment or pod spec to increase resource limits.
Example command:
resources:
  requests:
    memory: "512Mi"
    cpu: "250m"
  limits:
    memory: "1Gi"
    cpu: "500m"
Use autoscaling to dynamically adjust workloads based on demand:
Example command:
kubectl autoscale deployment [deployment_name] --cpu-percent=50 --min=1 --max=52. Resolving Kubelet Issues
Kubelet failures are a frequent cause of the “Not Ready” status. Try the following fixes:
Restart the kubelet service:
Example command:
systemctl restart kubeletInspect kubelet logs for errors:
Example command:
journalctl -u kubelet- Verify kubelet configurations such as the kubeconfig file and API server address. Ensure they are correctly pointing to the control plane.
3. Fixing Network Connectivity
If network issues are causing the error, take these steps:
- Ensure DNS resolution: Verify that the node can resolve cluster services by inspecting /etc/resolv.conf.
- Check firewall rules: Ensure that the node can communicate with the control plane and other nodes on required ports.
- Example: Open port 6443 for API server communication.
Test connectivity between the node and master server using:
Example command:
telnet [master_node_IP] 64434. Handling Disk Pressure or Storage Issues
Nodes under disk pressure often become “Not Ready.” Free up space and manage storage:
Clear unused container images:
Example command:
docker system pruneDelete unnecessary logs:
Example command:
rm -rf /var/log/*Review eviction policies: Adjust Kubernetes eviction thresholds to better manage disk pressure.
Example command:
evictionHard:
  nodefs.available: "10%"
  imagefs.available: "15%"
By applying these fixes, you can address the most common causes of the Node Not Ready error and restore your node’s functionality. Next, we’ll discuss best practices for preventing these errors in the future.
Best Practices for Preventing Node Not Ready Errors
While resolving a Node Not Ready error is important, preventing it from happening in the first place is even better. Implement these best practices to ensure the health and stability of your Kubernetes cluster:
1. Proactive Monitoring and Alerts
- Use tools like Prometheus and Grafana to continuously monitor node health and resource utilization.
- Set up alerts for critical thresholds, such as high CPU, memory usage, or disk pressure, so you can act before issues escalate.
2. Regular Maintenance
- Periodically clean up unused container images, logs, and other temporary files to free up disk space.
Example command:
docker system prune- Perform regular node health checks using kubectl or third-party tools.
3. Enable Cluster Autoscaling
- Use Cluster Autoscaler to automatically add or remove nodes based on workload demands. This ensures your cluster can handle spikes in resource usage.
Example command to enable autoscaling:
kubectl autoscale deployment [deployment_name] --cpu-percent=70 --min=2 --max=104. Optimize Workloads
- Properly allocate resources to pods by defining requests and limits in the pod spec.
Example:
resources:
  requests:
    memory: "256Mi"
    cpu: "100m"
  limits:
    memory: "512Mi"
cpu: "250m"- Avoid overloading nodes with excessive workloads by using horizontal pod autoscaling.
5. Kubelet Configuration Audits
- Regularly review kubelet configurations to ensure they are optimized for your cluster’s workload and setup.
- Adjust eviction policies to prevent nodes from becoming “Not Ready” due to resource exhaustion.
By adopting these best practices, you can significantly reduce the likelihood of encountering Node Not Ready errors, ensuring a healthier and more resilient Kubernetes environment. In the next section, we’ll explore how NudgeBee can help you proactively manage and troubleshoot node issues.
How NudgeBee Helps with Node Health Management
Managing Kubernetes nodes efficiently requires the right tools to detect, diagnose, and resolve issues quickly. This is where NudgeBee’s AI-driven platform can make a significant difference. With advanced monitoring and troubleshooting capabilities, NudgeBee helps ensure your nodes remain healthy and your workloads run seamlessly.
Key Features of NudgeBee
- Automated Detection of Node Issues
- NudgeBee’s platform continuously monitors your cluster to detect problems like the Node Not Ready error.
- It provides real-time alerts so you can act before the issue escalates.
- Guided Troubleshooting for Quick Resolutions
- The Troubleshooting Agent offers step-by-step recommendations tailored to the specific issue.
- Whether it’s resource exhaustion, kubelet errors, or network problems, NudgeBee helps you resolve the root cause efficiently.
- Real-Time Resource Monitoring
- Tracks node and pod performance metrics, such as CPU, memory, and disk usage.
- Identifies resource bottlenecks early, helping to prevent unnecessary node downtime.
- Anomaly Detection and Proactive Insights
- Uses AI to analyze trends and predict potential issues, enabling proactive management.
- Provides actionable insights to optimize node configurations and prevent recurring errors.
Why Choose NudgeBee?
- Simplified Node Management: NudgeBee automates complex troubleshooting tasks, saving time and reducing manual effort.
- Enhanced Cluster Stability: Proactively prevents errors like Node Not Ready through intelligent monitoring and guided resolutions.
- Comprehensive Insights: Offers a clear overview of your cluster’s health, empowering you to make data-driven decisions.
Ready to keep your Kubernetes nodes healthy and error-free? Explore how NudgeBee can simplify Kubernetes node management and optimize your cluster today.
Conclusion
The Node Not Ready error in Kubernetes can disrupt your workloads and impact the stability of your cluster. Understanding its causes—such as resource exhaustion, kubelet failures, or network issues—and applying systematic troubleshooting methods are essential to resolving this issue effectively.
By diagnosing problems using tools like kubectl describe and logs, and implementing fixes like resource reallocation, kubelet restarts, or disk cleanup, you can quickly bring your nodes back to a healthy state. However, prevention is always better than a cure. Following best practices like proactive monitoring, regular maintenance, and enabling cluster autoscaling can minimize the chances of encountering this error in the future.
To simplify node management and troubleshooting, tools like NudgeBee can make all the difference. With real-time monitoring, guided remediation, and proactive insights, NudgeBee helps you resolve issues faster and maintain a robust Kubernetes environment.
Resolve Kubernetes node issues effortlessly with NudgeBee. Get started today and experience seamless cluster management!